Post 13: Tshark Filters
January 8, 2019 at | In Network Forensics | No CommentsOther than using wireshark to capture and analyze traffic, we can also use Tshark, the command line version of wireshark. In this post, I will list some commands that can be use to filter pcap files using Tshark. In this tutorial, I will use Kali Linux’s terminal.
Capture Packets
Command: tshark -i wlan0 -w <filename>.pcap
Read a Pcap file
Command: tshark -r <filename>.pcap
Analyze HTTP
Command: tshark -i wlan0 -Y http.request -T fields -e http.host -e http.user_agent
Analyze DNS
Command: tshark -i wlan0 -f “src port 53” -n -T fields -e dns.qry.name -e dns.resp.addr
Source:
- https://hackertarget.com/tshark-tutorial-and-filter-examples/
Post 12: TCP & UDP
January 8, 2019 at | In Network Forensics | No CommentsTCP and UDP are one of the most well-known protocols. TCP, or transmission control protocol is a protocol that works with the IP to define how computers send packets of data to another computer, and vice versa. UDP, also known as user datagram protocol, is used to establish low-latency and loss-tolerating connections between internet applications.
Differences Between TCP and UDP
- TCP sends individual packets, while UDP sends messages, known as datagrams
- TCP is a reliable data transfer protocol, while UDP is unreliable when it comes to data transfer protocol
- TCP has segment sequencing, while UDP does not have sequencing
- TCP port range is from 0 – 65535. UDP port range is from 0 – 65536
- TCP is connection-oriented, while UDP is connectionless
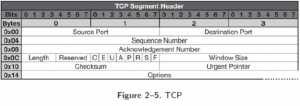
TCP Header
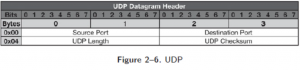
UDP Header
Source:
- https://searchnetworking.techtarget.com/definition/TCP
- https://enterprise.netscout.com/edge/tech-tips/difference-between-tcp-and-udp
Post 11: Network-Based Evidence Sources
January 8, 2019 at | In Network Forensics | No CommentsTo find evidence, there are many ways investigators can find it. Using different type of sources, this can help investigators to investigate further on a network incident. In this post, I will explain some of the sources that can be used to find evidences.
On the Wire
This source means that investigators can also investigate physical cable that carry data over to the network. An example of network cabling is copper and fiber-optic lines. The forensic value of cable is that wire tapping can provide network data in real-time.
In the Air
Using wireless signals is also one of the ways to find evidences in a network. The example of in the air related evidence are WiFi, Bluetooth, infrared, and NFC. The forensic value is that valuable information can still be obtained, even if the information is mostly encrypted.
Switches
Switch is a device with multiple ports that is use to connect different network segments together, and it can be managed and unmanaged. The forensic value is that switches can be a platform to capture and preserve the network traffic.
Routers
Router is a device that can forward packets through the network. It is connected around two networks, mostly LAN or WAN. The forensic value of router is able to be basic packet filters and route table, which map ports on the router to the connected networks.
Source:
- https://www.webopedia.com/TERM/R/router.html
Post 10: About DNS
January 8, 2019 at | In Network Forensics | No CommentsDNS, also known as Domain Name Server, is a server that has public IP addresses database and the hostname. It also can translate to IP address from domain names. DNS servers use special protocol to communicate with each other and run special software.
Why we need DNS software? It’s because we can understand domain name in an easier way, rather that IP addresses that consists of numbers to access the internet.
DNS System
DNS System consists of domain name servers that provide the name to IP address mapping for servers/devices on the internet. Internet Service Providers (ISP) and companies mainly have their own DNS servers that are linked to the root servers to provide a distributed system.
Problems in DNS
One of the most common problems in DNS is that DNS might be the main problem is when we cannot connect to the internet because of having problems trying to connect to the resources.
Source:
- https://www.lifewire.com/what-is-a-dns-server-2625854
- http://www.steves-internet-guide.com/dns-guide-beginners/
Post 9: Centralized Logs
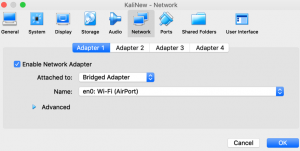
January 8, 2019 at | In Network Forensics | No CommentsCentralized logs is where we can see the activity of a virtual machine in another virtual machine. To try centralized logs, it is important to have one virtual machine that will act as the log server, and a second virtual machine. In this tutorial, I will use kali linux as the OS for both virtual machines. Then set the connection of both virtual machines into bridged adapter by selecting the virtual machine from the VirtualBox application, then go to network, and select the Bridged Adapter option. Do the same to the second virtual machine.
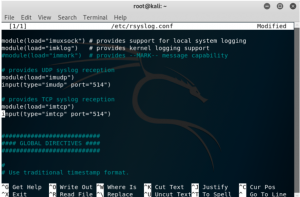
Start the first virtual machine that will be the log server, then open its terminal. Edit the file /etc/rsyslog.conf using the command “nano cat /etc/rsyslog.conf”, and uncomment the lines that provides the UDP and TCP syslog reception, by erasing the #. Imudp stands for input module UDP, and imtcp stands for input module TCP. Enabling the two modules will open port 514 from both UDP and TCP for incoming log data from other virtual machines.
After finish editing the modules, save the file and use the command “service rsyslog restart” to restart syslog. Now check if the port 514 from UDP and TCP has been open using the “netstat -pln | grep 514” command, and it will show just like the screenshot below if it’s been opened. 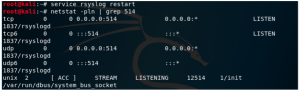
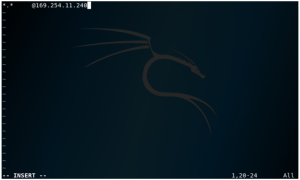
Check the first virtual machine’s IP address using if config. Make sure that the first and second virtual machines’s IP address is not the same or else centralized log will not work.
Open the second virtual machine that will act as the client. Open it’s terminal, and create file in etc/rsyslog.d/test.conf using the command vim /etc/rsyslog.d/test.conf. A blank page will appear in the terminal, then press “i” to write. In the file, write “*.* @Log server IP address”. To save the file, press the “esc” button first on the keyboard, then write “:wq” to save and quit the editor.
To check the configuration, type cat /etc/rsyslog.d/test.conf, and the result shown will be the same entry that is written in the test.conf file in the previous step. ![]()
Go back to the log server to monitor the log, and use the command tail -f /var/log/syslog /var/log/auth.log. This will show that the current log will only come from the VM as the log machine. 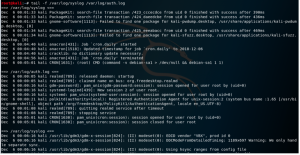
Then go back to the second VM, which is the client, and type service rsyslog restart. Go back to the first VM, and check that the name of the other VM is shown in the log server, as shown in the screenshot below. 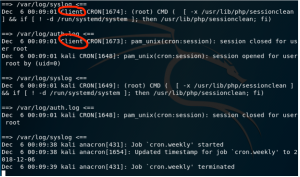
Post 8: What is Network Forensics?
January 8, 2019 at | In Network Forensics | No CommentsMost people are not familiar with the word network forensics. So in this post, I will explain what is network forensics itself.
Network forensics is investigations that can obtain and analyze the information about what happens in a network. It is a sub-branch of digital forensics where investigators will monitor and analyze the network traffic to gain information and obtain evidence.
Most people also seem to mistaken network forensics with network security, but there are differences between the two. In network security, the system is protected against an attack, while in network forensics, the system is not protected against an attack. Network forensics means investigating after the incident has been done, while in network security, it is usually done in real time.
Network forensics is important and we need it, because it is part of incident responses, where investigators will investigate the incident very carefully. It is also important because evidences are collected for the law enforcement/court, and find the cause of the incident, which will be a lesson to learn so that similar incidents will not happen again in the future.
In network forensics, investigators also had their own challenges they need to face, which are:
- Intelligent network forensics tools
- Data extraction locations
- Access to IP address
- Data Privacy
- Data integrity
- Data storage on the network devices, and
- High speed data transmission
Post 7: Network Forensics Investigation Methodology (TAARA)
January 8, 2019 at | In Network Forensics | No CommentsContinuing from the previous post, there is another network investigation methodology that I am going to discuss, which is the TAARA methodology.
TAARA methodology consists of:
- Trigger
- Acquire
- Analysis
- Report
- Action
Trigger
This process is the start of the incident that will lead the investigators to start investigating the incident.
Acquire
After the incident has been triggered in the previous process, investigators need to get the information relating to the incident being triggered, the reasons to suspect the incident and getting the evidences for further investigation.
Analysis
After getting all the evidences in the previous step, the collected evidences will be collected and arranged, and analyzed. The timeline of the events will also be arranged in this step.
Report
In this step, the report of the finding is produced and presented to the stakeholders. Investigators can also give suggestions to the stakeholders, so that the stakeholders can know what actions they need to take next.
Action
The suggestions suggested by investigators will take action in this step.
Post 6: Network Forensics Investigation Methodology (OSCAR)
January 8, 2019 at | In Network Forensics | No CommentsIn order to get better results when investigating, it is important for investigators to do the investigation process based on the methodology framework. There are two types of methodologies that forensics investigators can use to guide them through their investigation. In this post, I am going to explain the first methodology, which is OSCAR.
OSCAR consists of:
- Obtain information
- Strategize
- Collect evidence
- Analyze
- Report
I am going to explain each of these processes.
Obtain information
In this process, investigators gets information about the incident and the environment where the incident takes place. For the incident. investigators needs to know the descriptions and the time of the incident, people involved in the incident, data and systems involved, and legal issues. For the network, investigators needs to know the network topology, the organization structure where the incident takes place, and the available resources.
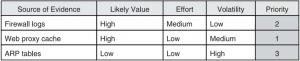
Strategize
After getting the information needed to investigate, the investigators need to work together with other investigators to discuss about the case. They also need to prioritize the source of evidence. The example of evidence prioritization is shown below.
Collect Evidence
Investigators decided on a plan based on the evidence obtained. Then, they should arrange all the gathered evidence based on the order. Investigators need to document their evidence, which can be useful in the future when they need it. It is also important for investigators to capture the evidence, for example by saving the network traffic in a pcap file format or take screenshots of the network traffic. And lastly, investigators also need to store the collected evidences in a safe place, and make sure that the people having access to it is trustable,
Analyze
In the analyze process, investigators needs to show correlation with multiple source of evidence, arrange the evidences based on the timeline, and make educated interpretations of evidence that leads to further investigations. In this process, it is important for investigators to separate interpretations from the facts.
Report
After investigators have finished with their investigations, they are required to make a report based on their findings. The report should be understandable to the people who do not understand technical terms, complete, defensible, and factual.
Post 5: Web Proxies
January 8, 2019 at | In Network Forensics | No CommentsWeb proxy is one of the ways to hide IP address from visited websites. When using web proxy, the website will not be able to see where you came from because the web proxy will make the website think that you are accessing the website from a different location from where you currently are. There are three methods of web proxies, which are forward proxy, reverse proxy, and tunneling proxy.
Forward Proxy
- Provides proxy services for a single client and group of clients. For multiple clients, mostly they used the same network.
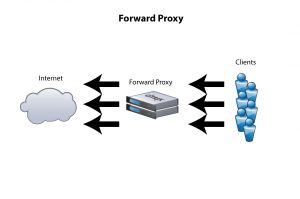
- To connect to the network, the client’s request has to pass the proxy first before it can connect to the internet.
Reverse Proxy
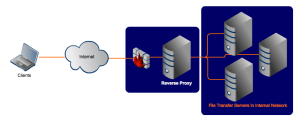
- Accepts the request from clients on behalf of the servers.
- Can inspect the content first before connecting to the internet
Tunneling Proxy

- Lets users that connects to either public or private network with proxy to transmit data by encapsulating the data.
- Example: VPN (Virtual Private Network
Source:
- https://www.lifewire.com/what-is-web-proxy-3481607
- https://www.citrix.com/blogs/2010/10/04/reverse-vs-forward-proxy/
- http://2.bp.blogspot.com/-08V2nH2GClU/VjpSnA1kl1I/AAAAAAAABOk/jtTzIzhcvRE/s1600/image2.png
Post 4: TCP/IP
January 8, 2019 at | In Network Forensics | No CommentsTransmission Control Protocol/Internet Protocol, also known as TCP/IP, is network suite the uses protocols to connect network-related devices to the internet. TCP/IP provides end-to-end communications to specify how the data is exchanged over the internet and specify how to break data into packets when sending it into another network. The function of TCP is to define how applications can create communication channels across the network and manage the way a message is assembled to smaller packets before being send over the internet and assembled back to the way it was before after arriving at the destination. TCP/IP works using a client/server type of communication, where the client is being provided with a service by another server in the same network.
TCP/IP Layer
TCP/IP layer has 4 layers, compared to the OSI layers that has 7 layers.
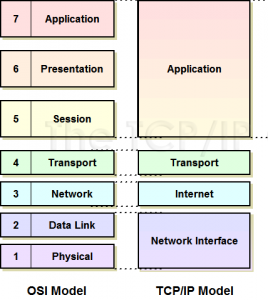
The TCP/IP layers are divided into 4 layer types, which consists of lower-level layer, transport layer, and higher-level layer. I am also going to explain each of the layers from OSI briefly.
Network Interface Layer
- Defines how data is sent physically through the network, especially on how bits are signaled by hardware devices that connects with a physical network medium such as fiber optic cable and copper wire.
Internet Layer
- Compile data into IP datagrams, which consists of source and destination address .
- Routing IP datagrams
- Main protocols: IP (internet protocol), ICMP (internet control message protocol), ARP (Address Resolution Protocol)
Transport Layer
- Let devices at the source and destination communicate/use protocols.
- Main protocols: TCP (Transmission Control Protocol), UDP (User Datagram Protocol)
Application Layer
- Defines TCP/IP
- Main protocols: DNS (Domain Naming System), HTTP (Hypertext Transfer Protocol)
Source:
- http://www.tcpipguide.com/free/t_NFSArchitectureandComponents.htm
- http://www.tcpipguide.com/free/t_PhysicalLayerLayer1.htm
- http://www.omnisecu.com/tcpip/tcpip-model.php
Powered by WordPress with Pool theme design by Borja Fernandez.
Entries and comments feeds.
Valid XHTML and CSS. ^Top^